The graph shown exhibits constant returns to scale: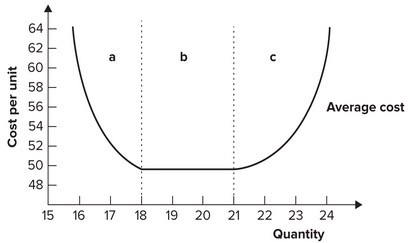
A. in region a.
B. in region c.
C. in regions a, b, and c.
D. in region b.
Answer: D
You might also like to view...
The demand curve for low-skilled labor lies to the left of the demand curve for high-skilled labor because
A) there are more high-skilled workers than low-skilled workers. B) high-skilled workers require more compensation than low-skilled workers. C) high-skilled workers are more productive than low-skilled labor. D) firms do not see any difference between high-skilled labor and low-skilled labor.
When society gets the most it can from its scarce resources, then the outcome is called
a. equitable. b. efficient. c. normal. d. efficacious.
If the variable cost curve is a straight line, then the
A. marginal cost curve may be U-shaped. B. marginal cost curve is upward sloping. C. marginal cost curve will be U-shaped. D. marginal cost curve will be horizontal.
Answer the following statement true (T) or false (F)
1) Fiscal policy is more susceptible to politicization than monetary policy. 2) Changes in tax rates are a form of monetary policy. 3) Monetary policy attempts to change the level of spending by altering interest rates. 4) The problem of limited and bundled choices explains why many voters cannot fully express their political preferences. 5) Regulatory capture occurs when government exerts excessive control over an industry.