Solve.The following graph shows the number of male and female athletes at a university over a four-year period. 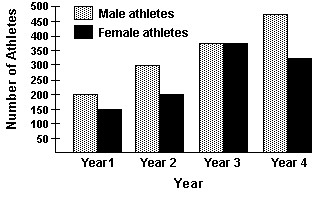 Which year had the smallest number of male athletes? What was the total number of male athletes that year?
A. Year 1; 150 athletes
B. Year 4; 475 athletes
C. Year 1; 200 athletes
D. Year 2; 300 athletes
Answer: C
You might also like to view...
Provide an appropriate response.A shipment of 20 digital cameras contains two that are defective. A random sample of three is selected and tested. Let X be the random variable associated with the number of defective cameras in a sample. Find the probability distribution of X and the expected number of defective cameras in a sample.
What will be an ideal response?
Solve the problem.A box of instant brownies has the list of ingredients shown in the table. Use this information to find the amount of the stated ingredient you would need to make the indicated number of servings. Water3 tablespoonsOil
 cupNuts
 cupBrownie Mix2
 cupsAmount of oil for 10 servings
A.  tablespoon(s)
B.  cup
cup
C.  cup
cup
D.  cup
cup
Find the quotient and the remainder.x4 + 6x2 + 8 divided by x2 + 1
A. x2 + 5x +  ; remainder 3
B. x2 + 5x + 1; remainder 0
C. x2 + 5; remainder 3
D. x2 + 5; remainder 0
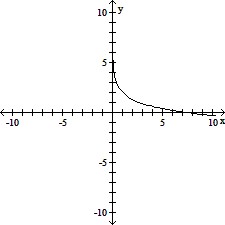
Graph the function.f(x) = 2 - ln(x + 4)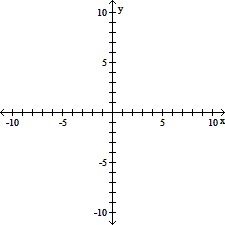
A. 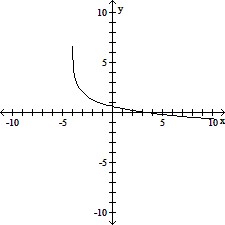
B. 
C. 
D.