Solve the problem.The results of a school election for student president are shown in the following table. 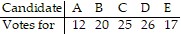 What is the probability that a randomly polled voter voted for Candidate C?
A. 0.6
B. 0.25
C. 0.5
D. 0.3
Answer: B
You might also like to view...
Find the amount that will be in an account, given the stated conditions.P = $1560, t = 19, r = 6% compounded continuously
A. $2139.29 B. $37,016.08 C. $4877.76 D. $20,841,173.82
Graph the function by starting with the graph of the basic function and then using the techniques of shifting, compressing, stretching, and/or reflecting.f(x) = x2 + 2
A. 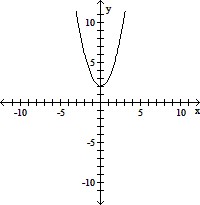
B. 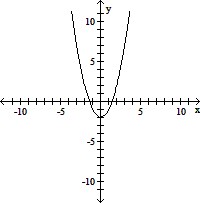
C. 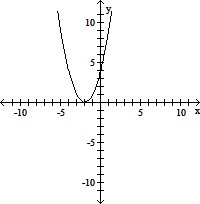
D. 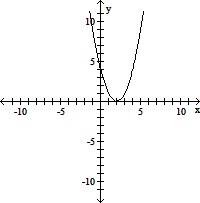
The circle graph shows the results of the student council presidential election. The complete circular area represents 100% of the votes.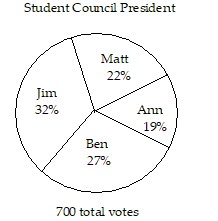 The circle graph shows what percent of the vote each person received.Who got the most votes?
A. Matt B. Jim C. Ann D. Ben
Use the position function 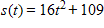 to find the velocity in feet/second at time
  seconds. The velocity at time
src="https://sciemce.com/media/3/ppg__cognero__Section_12.2_Techniques_for_Evaluating_Limits__media__821cc22f-a0b0-4d94-869d-efd3a56443a1.PNG" style="vertical-align:middle;" /> seconds is given by 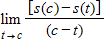 .
?
A. 16 feet/second
B. 32 feet/second
C. 0 feet/second
D. 64 feet/second
E. limit does not exist
.
?
A. 16 feet/second
B. 32 feet/second
C. 0 feet/second
D. 64 feet/second
E. limit does not exist