This graph demonstrates the domestic demand and supply for a good, as well as the world price for that good.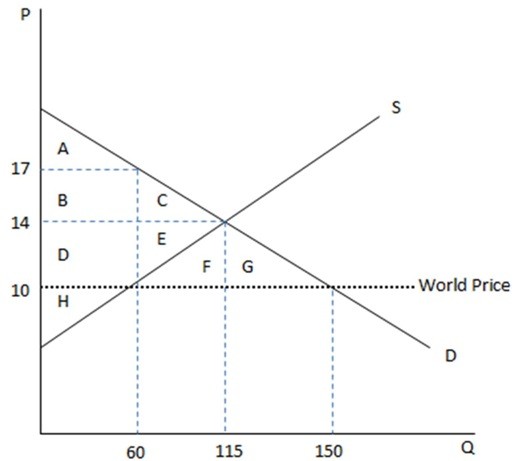 According to the graph shown, if this were depicting an autarky, the amount being bought domestically is:
A. 60 at $10 each.
B. 115 at $14 each.
C. 60 at $17 each.
D. 150 at $10 each.
Answer: B
You might also like to view...
If the graph shown represents Taylor's budget constraint, which of the following consumption bundles could Taylor choose?
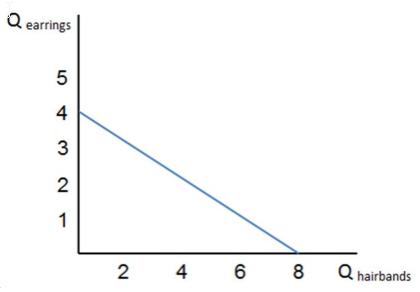
A. Taylor cannot choose to consume any of these bundles
B. Two pairs of earrings and six hairbands
C. One pair of earrings and six hairbands
D. Four pairs of earrings and eight hairbands
The financial system is made up of the:
A. institutions that bring together savers, borrowers, investors, and insurers in a set of interconnected markets where people trade financial products. B. government's offices that keep watch over all transactions conducted between savers and lenders. C. government's offices that regulate over all transactions conducted between borrowers and savers. D. government and monetary authority.
Other things equal, when the U.S. dollar depreciates, domestic exports rise at every level of domestic income
a. True b. False Indicate whether the statement is true or false
Individuals with higher saving and investment rates will more likely
What will be an ideal response?