The pie chart below shows the number of pizzas consumed by college students in a typical month. Use the chart to answer the question. 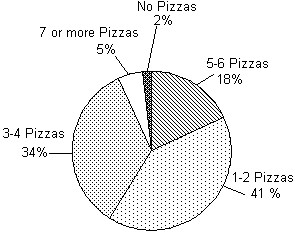 What percent of college students consume 1-2 pizzas in a typical month?
A. 18%
B. 34%
C. 41%
D. 2%
Answer: C
Mathematics
You might also like to view...
Find the extreme values of the function subject to the given constraint.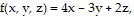

A. Maximum: none; minimum:  at
at 
B. Maximum: none; minimum:  at
at 
C. Maximum: none; minimum:  at
at 
D. Maximum: none; minimum:  at
at 
Mathematics
Graph the curve whose parametric representation is given. x = cos t, y = -9 sin2 2t; 0 ? t ? ? 
A. 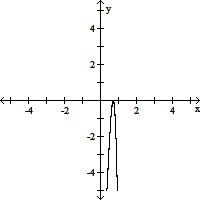
B. 
C. 
D. 
Mathematics
Find the GCF.304 and 608
A. 16 B. 304 C. 19 D. 152
Mathematics
Find the difference and simplify the answer.  -
- 
A. 
B. 
C. 
D. 
Mathematics