Construct a bar graph to represent the given data.The following table shows the average amount spent per week on groceries by four different families with three members.
What will be an ideal response?
Answers may vary. The following is a possible answer.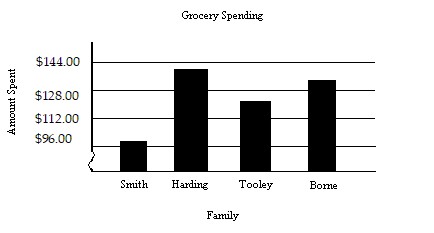
Mathematics
You might also like to view...
Graph the ellipse. +
+  = 1
= 1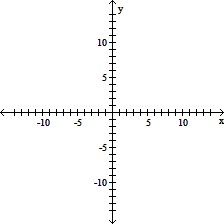
A. 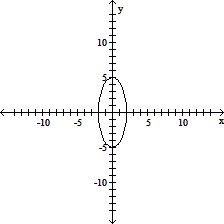
B. 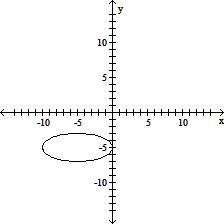
C. 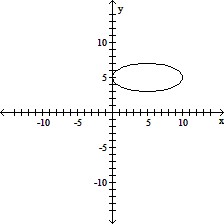
D. 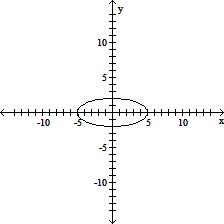
Mathematics
Divide, when possible.
A. 1246 B. 1256 r20 C. 1251 r12 D. 1236
Mathematics
Find the product AB, if possible.A =  , B =
, B = 
A. 
B. AB is not defined.
C. 
D. 
Mathematics
Solve the problem.Mary finds 9 fish at a pet store that she would like to buy, but she can afford only 5 of them. In how many ways can she make her selection? How many ways can she make her selection if he decides that one of the fish is a must?
A. 3024; 1680 B. 15,120; 1680 C. 126; 70 D. 7560; 840
Mathematics