These are the cost and revenue curves associated with a firm.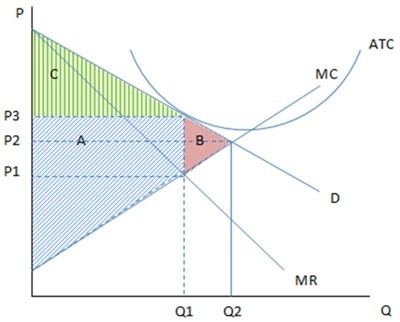 Assuming the firm in the graph is producing Q1 and charging P3, it is likely showing the cost and revenue curves of a firm in:
A. the long run, and no firms will enter or exit.
B. the short run, and firms will leave this market.
C. the long run, and firms will enter this market.
D. the short run, and firms will enter this market.
Answer: A
You might also like to view...
What factors other than the wage rate influence the demand for labor? How is demand affected by changes in these factors?
What will be an ideal response?
Bank capital is equal to ________ minus ________
A) total assets; total liabilities B) total liabilities; total assets C) total assets; total reserves D) total liabilities; total borrowings
The percentage of all sales contributed by the leading four or leading eight firms in an industry is known as
A) a horizontal merger. B) a vertical merger. C) economies to scale. D) the concentration ratio.
Since 1950, the volume of world trade and the volume of world real GDP
A. have both increased, but the volume of world trade has increased faster than the volume of world real GDP. B. have both decreased at roughly the same rate. C. have both increased at roughly the same rate. D. have both increased, but the volume of world trade has increased more slowly than the volume of world real GDP.