The following table shows the value V, in dollars, of an investment after t years.
t 0 1 2 3 V $3025.00 $3206.50 $3398.89 $3602.82?
A: Make a table of successive ratios to show that the value of the investment can be modeled by an exponential function. Round your answer to two decimal places.B: Find an exponential model for the data. Round your answer to two decimal places.C: Plot the graph of the data points along with the exponential model. Include up to 10 years.D: According to the model, when will the value of the account reach $7563.02? Round your answer to two decimal places.
What will be an ideal response?
A:
?
| Time increment | From  to to  | From  to to  | From  to to  |
| Ratios of V | 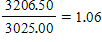 | 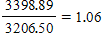 | 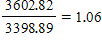 |
?
?
B: 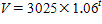
C: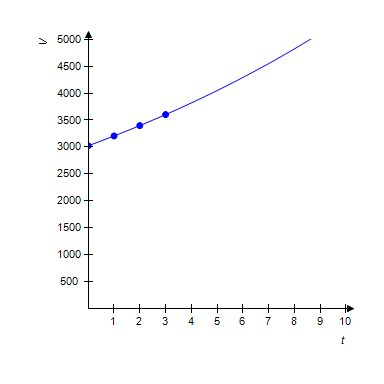
D: After 15.73 years
Mathematics
You might also like to view...
Evaluate the line integral along the curve C. ds , C is the straight-line segment x = 0, y = 2 - t, z = t from (0, 2, 0) to
A. 4
B. 4
C. 0
D. 2
Mathematics
Provide an appropriate response. Find the equation of the line with slope 2 and y-intercept -5.
A. y = 2x - 5 B. y = 2x + 5 C. y = -5x + 2 D. y = -5x - 2
Mathematics
Solve the problem.The graphs below represent the supply and demand for a product at various prices per unit. At what price does supply equal demand?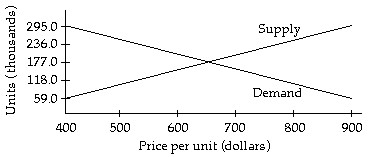
A. $900 B. $650 C. $400 D. $177
Mathematics
Write the geometric series in summation notation.4 - 1 +  -
-  +
+ 
A. 
B. 
C. 
D.  + 4
+ 4
Mathematics