This graph demonstrates the domestic demand and supply for a good, as well as the world price for that good.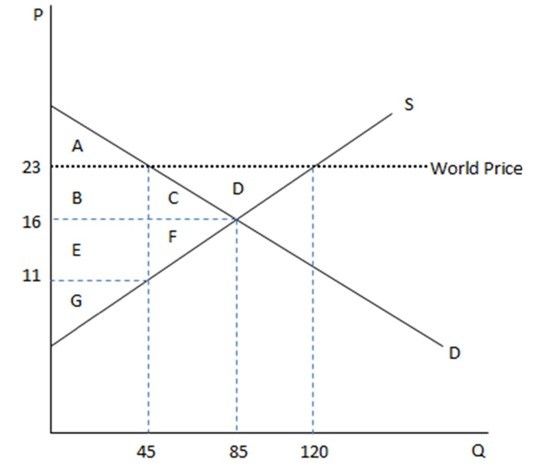 According to the graph shown, what is the world price?
A. $45
B. $11
C. $23
D. $16
Answer: C
You might also like to view...
Suppose that homemakers are included as employed in the labor force statistics, rather than being counted as out of the labor force. This would
A) increase the measured labor force participation rate. B) increase the measured unemployment rate. C) decrease the number of persons in the working-age population. D) decrease the number of persons in the labor force.
Each governor on the Board of Governors can serve
A) only one nonrenewable fourteen-year term. B) one full nonrenewable fourteen-year term plus part of another term. C) only one nonrenewable eight-year term. D) one full nonrenewable eight-year term plus part of another term.
You and your friend go out shopping for television sets for your respective apartments. You find the one you want to buy and pay extra money to have it delivered during the weekend. Your friend is unwilling to pay extra and will wait for the television to be delivered as per the store's usual practice. Which of the following conclusions can be drawn from this information?
a. You have a higher price elasticity of demand for the TV than your friend. b. Your opportunity cost of time is higher and than your friend's. c. Your friend's opportunity cost of time is higher than your's. d. Both of you have the same price elasticity of demand for the TV.
It is generally true that per capita GNP is:
a. negatively correlated with labor productivity. b. positively correlated with the standard of living. c. negatively correlated with the life expectancy rate. d. uncorrelated with the literacy level. e. positively correlated with the rate of population growth.