This graph shows the cost and revenue curves faced by a monopoly. 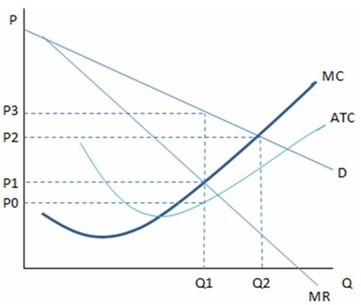 According to the graph shown, if this were a perfectly competitive market, the outcome in the short run would be:
A. Q1, P3.
B. The graph is of a monopoly, and therefore there is no way to determine a perfectly competitive outcome.
C. Q2, P2.
D. Q1, P1.
Answer: C
You might also like to view...
As the supply curve shifts to the right, the increase in quantity demanded will not depend on the shape of the demand curve
Indicate whether the statement is true or false
The graph shown demonstrates a tax on sellers. What is the amount of tax revenue being generated from the tax?
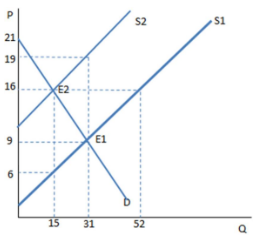
A. $150
B. $80
C. $310
D. $135
The overall drop in stock prices that began in 1929 and continued through 1932 was due to:
A. dropping stock prices causing a rational sale of certain stocks. B. a panicked massive sale of stocks which caused the stock prices to plummet. C. the exuberant confidence in the rising value of the stock market in general. D. the decline in profitability of companies.
Explain how the fixed cost curve affects the relationship between the total cost curve and the variable cost curve.
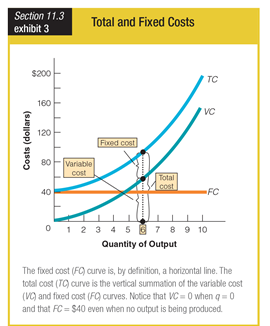
What will be an ideal response?