Solve the problem.The accompanying figure shows the graph of y = x2 shifted to a new position. Write the equation for the new graph.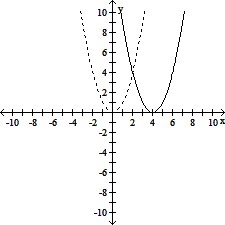
A. y = x2 + 4
B. y = (x - 4)2
C. y = x2 - 4
D. y = (x + 4)2
Answer: B
You might also like to view...
Solve the problem.Find the area between y = (x - 3)ex and the x-axis from x = 3 to x = 7.
A. e7 + e3 B. 3e7 C. e7 - e3 D. 3e7 + e3
Simplify. ?
? 
A. -26 B. -25 C. -13 D. 28
Find the equation of the regression line for the given data. Then use this equation to make the indicated estimate. Round decimals in the regression equation to three decimal places. Round estimates to three decimal places.The following data gives the temperature t (in °F) on randomly chosen days and the height h (in mm) that a certain type of plant grew. Find the equation of the regression line, and then estimate the growth of a plant if the temperature is 77°F.
A. h = 14.569t + 0.211, 1122.024 mm B. h = 53.999t + 0.181, 4158.104 mm C. h = 0.181t + 53.999, 67.936 mm D. h = 0.211t + 14.569, 30.816 mm
Find the function value.f(x) = x3, find f(3)
A. 64 B. 28 C. 9 D. 27