Refer to the above graphs. A price increase from $20 to $40 causes quantity demanded to decrease from 100 units to 50 units. Which graph best illustrates the price elasticity of demand for this good?
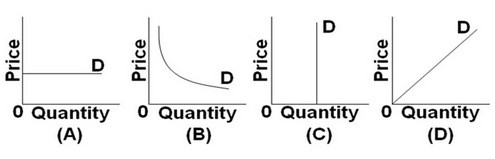
A. Graph A
B. Graph B
C. Graph C
D. Graph D
Answer: B. Graph B
You might also like to view...
Macroeconomic variables that the Fed cannot control directly but can influence fairly predictably, and which are related to the Fed's goals, are known as
A) instruments. B) tools. C) intermediate targets. D) initial targets.
The market demand for MP3 players is p = 50 - 0.5Q, and the marginal cost for Nick to obtain and sell an MP3 player is $12. If he receives 60% of the MP3 sales revenue, then
A) Nick will sell 38 MP3 players. B) Nick will sell 50 MP3 players. C) Nick will receive $270 as profit. D) total profit is $342.
When government intervenes in the production process because external costs exist, it typically attempts to shift the industry's
A) demand curve to the right. B) demand curve to the left. C) supply curve to the right. D) supply curve to the left.
Historical demand curves are always suspect because their demand curves are likely to have shifted over time
a. True b. False Indicate whether the statement is true or false