A) Canada
B) France
C) United States
D) Japan
B) France
C) United States
D) Japan
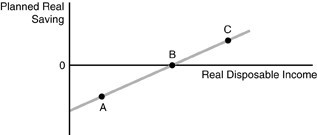 Refer to the above figure. The figure represents the saving function for the consumer. Point C represents
A. the amount of autonomous consumption.
B. a situation in which saving is positive.
C. a situation in which saving is negative.
D. the point at which saving equals zero.
Answer: B
Which of the following would NOT shift the U.S. aggregate demand curve?
A) a change in income in Canada B) a change in the quantity of capital in the United States C) an expectation that inflation will be lower in the future D) U.S. monetary and fiscal policy
Cindy's Sweaters' production function is shown in the above table. Cindy rents two knitting machines for $30 a day each and hires workers at a wage rate of $40 a day. What is the marginal cost of the 19th sweater?
A) $40.00 B) $20.00 C) $10.00 D) $8.00
World trade and tariffs have been regulated by the International Trade Organization (ITO), General Agreement on Tariffs and Trade (GATT) and the World Trade Organization (WTO)
Today, only the ITO still exists to address international trade issues and monitor the implementation of any trade agreements negotiated in the Uruguay Round of world trade talks. Indicate whether the statement is true or false
Which country has the highest per capita health care expenditures in the world?