Consumer surplus is represented graphically under the demand curve and below the equilibrium price.
Answer the following statement true (T) or false (F)
False
The area under the demand curve and above the equilibrium price represents total consumer surplus.
You might also like to view...
Refer to Mexico and Japan. Which of the following statements is true.
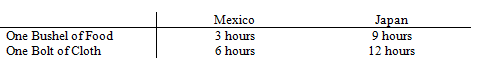
a. Mexico has a comparative advantage in production of food.
b. Japan has an absolute advantage in production of food.
c. Mexico has a comparative advantage in production of cloth.
d. Japan has an absolute advantage in production of Cloth.
Suppose the economy is in a long-run equilibrium when a temporary, favorable aggregate supply shock occurs. On the graphs above, show what happens to bring the economy back to long-run equilibrium, assuming that there is no policy response
In words, explain why "no response" is the best policy.
In recent years, the largest trading partners of the United States have been
What will be an ideal response?
Why do small differences in the rate of economic growth produce large differences in the size of the economy over time? Illustrate with an example
Please provide the best answer for the statement.