According to the graph shown, if this economy were to open to trade, consumers would:
This graph demonstrates the domestic demand and supply for a good, as well as the world price for that good.
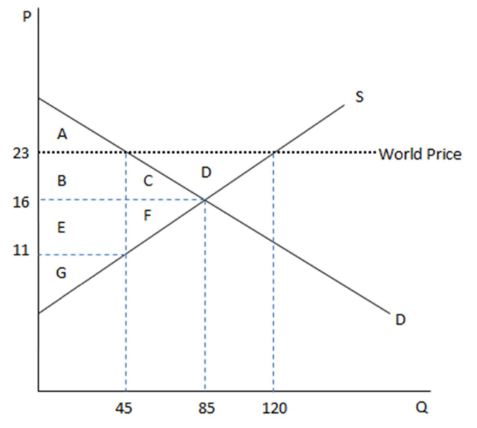
A. enjoy a net gain to surplus of DEFG.
B. suffer a net loss to surplus of DEFG.
C. suffer a transfer of surplus to the producer of DEFG.
D. experience deadweight loss of FG.
A. enjoy a net gain to surplus of DEFG.
You might also like to view...
If the supply of health care services is highly inelastic, programs that subsidize the cost of purchasing medical services will
a. lead to higher prices for medical services. b. lead to lower prices for medical services. c. not affect the price of medical services. d. help the buyers of medical services more than the sellers of those services.
A productivity increase is illustrated by a shift in the production function
A. downward. B. leftward. C. upward. D. rightward.
Refer to the table. In relation to column (3), a change from column (4) to column (5) would most likely be caused by:
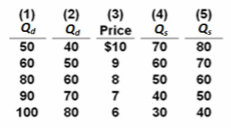
A. government placing an excise tax on the good.
B. an improvement in production technology.
C. an increase in consumer income.
D. an increase in input prices.
The economy of Bananaland can be characterized by Equation 24.5.EQUATION 24.5:C = 2,000 + 0.75YdT = 200G = 400I = 500Refer to Equation 24.5. If government spending in Bananaland increases by $50, equilibrium output increases by
A. $100. B. $200. C. $400. D. $800.