 Figure 4.5 illustrates a set of supply and demand curves for hamburgers. An increase in supply and a decrease in demand are represented by a movement from:
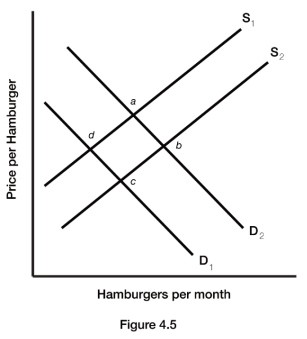
A. point d to point b.
B. point d to point a.
C. point a to point c.
D. point b to point d.
Answer: C
You might also like to view...
The production function graphs the relationship between
A) nominal GDP and real GDP. B) real GDP and the quantity of labor employed. C) real GDP and capital. D) nominal GDP and the quantity of labor employed. E) real GDP and the supply of labor.
The rich receive _____ all property income.
A. nearly B. about one-half of C. about one-quarter of D. a very small percentage of
A firm operating in a competitive market will stay in business in the short run so long as the market price exceeds the firm's average total cost; otherwise, the firm will shut down
a. True b. False Indicate whether the statement is true or false
Which of the following at one time were monopolies because they were the first to enter their field?
A. Xerox B. IBM C. Microsoft D. All of the choices are true.