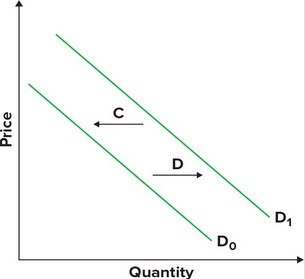
Refer to the graphs shown. The arrow that would best illustrate the impact on consumers of reducing sales tax on a good paid by suppliers is: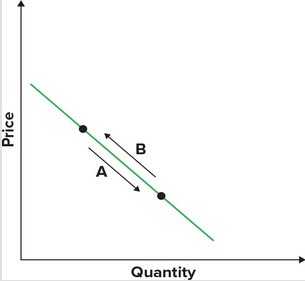
A. A.
B. B.
C. C.
D. D.
Answer: A
You might also like to view...
A prolonged recession in Europe should decrease the
A. supply of U.S. dollars. B. demand for U.S. dollars. C. supply of U.S. goods and services. D. demand by Americans for euros.
Which of the following correctly describes how the "global pie is baked"?
A) The United States' share of economic pie is increasing while China's share is decreasing. B) The increase in manufacturing has taken place in mainly the advanced economies. C) Asia accounts for about 40 percent of the global pie. D) Emerging economies account for about 25 percent of the global pie. E) Advanced economies account for about 50 percent of the value of the world's production.
International trade is restricted because
A) there is an uneven distribution of benefits and costs of free trade. B) free trade creates an inefficient use of resources. C) free trade leads to higher costs. D) free trade stifles diversity and stability.
Suppose the real money demand function is
Md/P = 2400 + 0.2Y - 10,000 (r + ?e). Assume M = 5000, ?e = .03, and Y = 5000. If the price level were to decrease from 2.5 to 2.0, then the real interest rate would decrease by how many percentage points (assuming Md, ?e, and Y are unchanged)? A) 4 B) 5 C) 9 D) 14