Provide an appropriate response.Discuss the differences between the distributions represented by the two boxplots below. Explain your reasoning.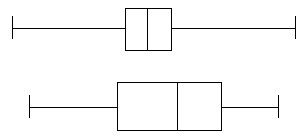
What will be an ideal response?
Answers will vary. Possible answer: The first boxplot represents a bell-shaped distribution since it is symmetrical and has long whiskers relative to the width of the box (indicating that observations close to the mean are more common than those far from the mean).
The second boxplot represents a left-skewed distribution, since the whisker to the left is relatively long.
You might also like to view...
If a projectile is fired with an initial velocity of  FIGURE 1.png) meters per second at an angle ? above the horizontal and air resistance is assumed to be negligible, then its position after t seconds is given by the parametric equations
meters per second at an angle ? above the horizontal and air resistance is assumed to be negligible, then its position after t seconds is given by the parametric equations  Figure 2.png) where g is the acceleration of gravity (9.8 m/s²). If a gun is fired with a = 55° and
where g is the acceleration of gravity (9.8 m/s²). If a gun is fired with a = 55° and  FIGURE 1.png) = 440 m/s when will the bullet hit the ground?
= 440 m/s when will the bullet hit the ground?
What will be an ideal response?
Convert the measurement as indicated.2 pt to fluid ounces
A. 36 fl oz B. 9 fl oz C. 4.5 fl oz D. 18 fl oz
Draw the graph of the line through the given point with the given slope.
A. 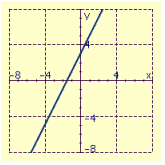
B. 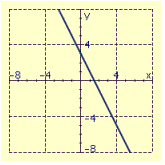
C. 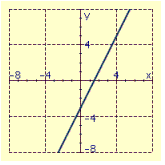
D. 
Find the percent using a proportion. Round your answer to the nearest tenth if necessary.955 animals is what percent of 1720 animals?
A. 55.5% B. 0.6% C. 0.1% D. 180.1%