Using a graph, explain the relationship between average cost and marginal cost.
What will be an ideal response?What will be an ideal response?
Refer to Figure 8.8. When output is finely divisible, the average cost curve is downward sloping at output level Q if marginal cost is below average cost. Conversely, the average cost curve is upward sloping at output level Q if marginal cost is above average cost. The average cost curve is neither rising nor falling when marginal cost equals average cost.
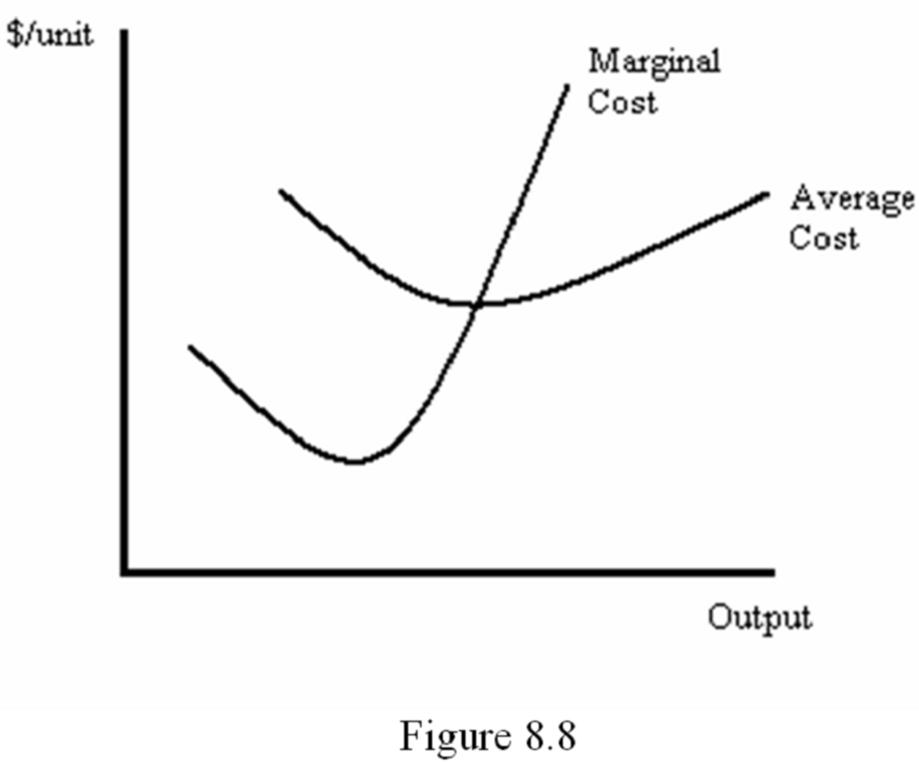
As illustrated in Figure 8.8, the marginal cost curve will intersect the average cost curve from below at the point where average cost is at its minimum.
You might also like to view...
Governments run a balanced budget when
A) their debt is interest-free. B) transfer payments equal zero. C) revenues equal spending. D) revenues exceed spending.
If the Fed pursues a strategy of targeting an interest rate when fluctuations in money demand are prevalent
A) fluctuations of nonborrowed reserves will be small. B) fluctuations of nonborrowed reserves will be large. C) the Fed will probably quickly abandon this policy, as it did in the 1960s. D) the Fed will probably quickly abandon this policy, as it did in the 1950s.
Economies of scale can be caused by all of the following except:
A. price discounts for large scale purchases. B. labor specialization. C. use of more productive equipment. D. increases in the firm's average total cost.
In the Cournot model, when a new firm begins production it assumes its demand curve is
A. the market demand plus the amount the other firm is selling. B. the same as the competing firm's demand curve. C. one-half of the competing firm's demand curve. D. the market demand less the amount the other firm is selling.