The following graph shows the monthly sales for Big "D" Sales during 2000 and 2001. Use the graph to solve the problem.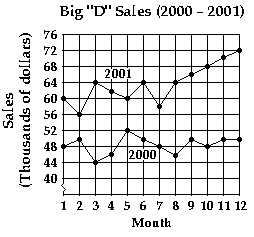 What were the total sales for the first six months of 2001?
A. $64,000
B. $366,000
C. $302,000
D. $286,000
Answer: B
Mathematics
You might also like to view...
Find an equation of the line tangent to the given curve at the point (a, f(a)). f(x) = -3e6x , a = 0
A. y = -3x - 3 B. y = 18x + 3 C. y = -18x - 3 D. y = 3x + 3
Mathematics
Find the greatest common factor of the list of items.x8y3, x2y6, x8y8
A. x2y3 B. x10y6 C. x8y8 D. x18y17
Mathematics
Provide an appropriate response.If f(p, q) = 3p2 - 2q+ p, find f(-1, 2).
Fill in the blank(s) with the appropriate word(s).
Mathematics
Find the first term and the common difference for the arithmetic sequence. Round approximations to the nearest hundredth.a5= 15, a21= 95
A. a1= -5, d = 5 B. a1= 80, d = -5 C. a1= -5, d = 80 D. a1= 80, d = 5
Mathematics