Using Figure 1 above, if the aggregate demand curve shifts from AD3 to AD2 the result in the short run would be: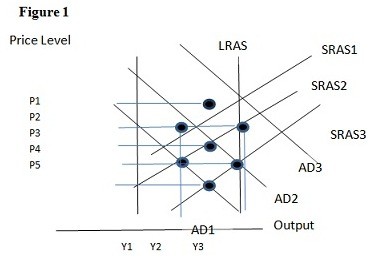
A. P3 and Y1.
B. P2 and Y1.
C. P2 and Y3.
D. P1 and Y2.
Answer: B
You might also like to view...
However, this type of bargaining will tend to be limited when:
You have data for sales of pizza for each of the 50 states in 2011. The type of graph to best display these data would be a
A) trend-line diagram. B) scatter diagram. C) multi-variable time-series graph. D) cross-section graph. E) time-series graph.
Four stores have a problem with theft and security is a public good. Let S stand for the number of person-hours of security patrols per week. The marginal benefit of security patrols to each of the stores is given by the formula MB = 200 - 2S. Patrols cost $20 per hour. What is the socially efficient level of security?
A. 90 person-hours of patrols per week B. 100 person-hours of patrols per week C. 92.5 person-hours of patrols per week D. 97.5 person-hours of patrols per week
The discount window is
A) another name for the discount rate. B) the means by which the Fed makes discount loans to banks. C) the spread between the discount rate and the T-bill rate. D) the period each month during which banks are allowed to apply for discount loans.