The circle graph shows the results of the student council presidential election. The complete circular area represents 100% of the votes.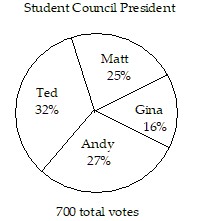 The circle graph shows what percent of the vote each person received.What percent of the votes did Matt NOT get?
A. 73%
B. 75%
C. 68%
D. 25%
Answer: B
Mathematics
You might also like to view...
Use the definite integral to find the area between the x-axis and the graph of f(x) over the indicated interval.f(x) = x2 + 1; [0, 1]
A. 
B. 
C. 
D. 
Mathematics
Find the area of the shaded region.
? ,
, 
 ?
?
A. 54 in.2 B. 12 in.2 C. 13.5 in.2 D. 27 in.2 E. 24 in.2
Mathematics
Solve the problem.The graph shows an idealized linear relationship for the average monthly payments (in dollars) to retirees from 2000 through 2004. Use the midpoint formula to estimate the payment for 2002.Average Monthly Payments to Retirees a = $452; b = $524
A. $488 B. $36 C. $524 D. $500
Mathematics
Determine whether the two pairs of numbers are proportional.12.56, 3.14 and 3.14, 0.785
A. Yes B. No
Mathematics