Exhibit 12-6 Lorenz curves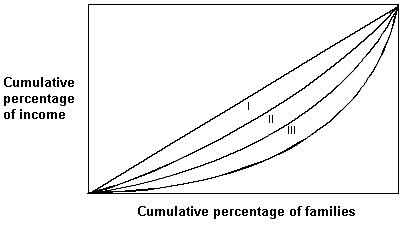
Exhibit 12-6 shows the Lorenz Curve for three countries, I, II, and III. Which of the following statements is true?
A. Country I has the most unequal income distribution.
B. Country II has the more equal income distribution than Country I.
C. Country I has the most equal income distribution.
D. Country III has the most equal income distribution.
Answer: C
You might also like to view...
The marginal propensity to consume:
A. is the amount by which consumption increases when after-tax income increases by $1. B. is closely linked to the multiplier effect of government spending. C. is a value between 0 and 1. D. All of these are true.
The position of the long-run Phillips curve is determined by
A. the quantity of money B. the natural unemployment rate C. the inflation rate D. the expected inflation rate.
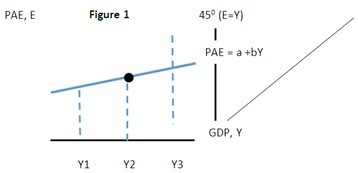 In Figure 1 above if the economy were at Y1 then we would expect there to be:
A. no change in inventories. B. an increase in inventories. C. a reduction in inventories. D. an increase in consumption spending.
If the income elasticity for lobster is 0.6, a 25 percent increase in income will lead to a:
A. 15 percent increase in demand for lobster. B. 2.4 percent increase in demand for lobster. C. 6 percent drop in demand for lobster. D. 42 percent increase in demand for lobster.