In the graph showing the Phillips curve after a negative supply shock, we can see that high energy prices in the late 1970s caused ______.
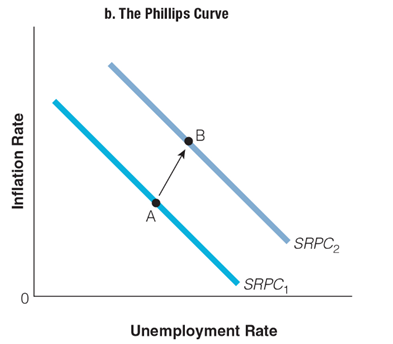
a. an increase in inflation rate and a decrease in unemployment rate
b. a decrease in inflation rate and an increase in unemployment rate
c. an increase in both inflation and unemployment rates
d. a decrease in both inflation and unemployment rates
c. an increase in both inflation and unemployment rates
You might also like to view...
The main reason for the rising market value of corporate stock is
A) falling interest rates. B) changes in tax laws. C) increases in the prices of existing stock. D) the increased supply of new stock.
Financial intermediaries reduce transactions costs by
A) charging fees to small savers. B) charging fees to small investors. C) taking advantage of economies of scale. D) avoiding risky investments.
When attempting to decrease the federal funds rate, the Fed can
A) increase reserve requirements. B) engage in an open market purchase. C) increase the discount rate. D) raise the interest rate paid on bank reserves.
Considering the market for loanable funds as depicted in the given graph, a change that increased the quantity people want to save at any given interest rate would cause a new equilibrium at a:
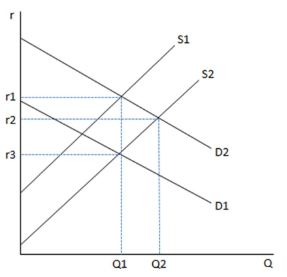
A. lower interest rate and a higher equilibrium quantity of funds saved and invested.
B. higher interest rate and a higher equilibrium quantity of funds saved and invested.
C. lower interest rate and a lower equilibrium quantity of funds saved and invested.
D. higher interest rate and a lower equilibrium quantity of funds saved and invested.