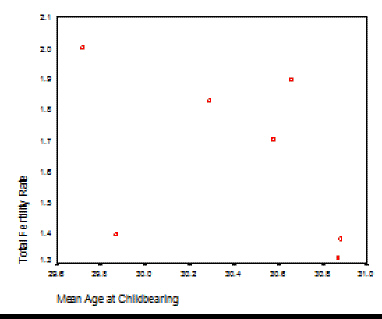
The following data on fertility rates were obtained from Eurostat on seven European countries in 2006. Considering the total fertility rate as your dependent variable, construct a scatter diagram and plot the seven observations in the table.
Mean Age at ChildbearingTotal FertilityRate Denmark30.291.83Ireland30.661.90Greece29.871.39Spain30.881.38France29.722.00Italy30.871.32Netherlands30.581.70 Mean30.411.65Standard Deviation0.47.28Variance.22.08
What will be an ideal response?
Sociology
You might also like to view...
Discuss social interaction and its key features.
What will be an ideal response?
Sociology
All of the following are reasons for cohabiting EXCEPT:
a. a trial marriage. b. reducing the likelihood of divorce. c. a permanent alternative to marriage. d. a short-lived sexual fling.
Sociology
All of the following are support groups that help children cope with death and life-threatening illness EXCEPT
A. The Meditational Healing Society. B. Starlight Children's Foundation. C. Camp Jamie. D. HUGS.
Sociology
The demographic roots of violence in sub-Saharan Africa are related especially to
a. the high maternal mortality rate. b. high mortality from violent causes. c. refugees leaving the area. d. the impact of the youth bulge.
Sociology