Plot and interpret the appropriate scatter diagram.The table gives the times spent watching TV and the grades of several students.  Effect of Watching TV on Grades
A. Effect of Watching TV on Grades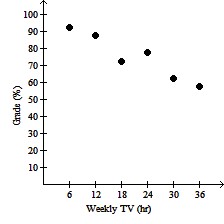
More hours spent watching TV may
reduce grades.
B. Effect of Watching TV on Grades
More hours spent watching TV may
reduce grades.
C. Effect of Watching TV on Grades
More hours spent watching TV may
increase grades.
D. Effect of Watching TV on Grades
More hours spent watching TV may
increase grades.
Answer: A
You might also like to view...
Solve the problem.The lifetime of an appliance that costs $100 is exponentially distributed with a mean of 2 years. The manufacturer gives a full refund if the appliance fails in the first year following its purchase. If the manufacturer sells 300 printers, how much should it expect to pay in refunds?
A. $18,196 B. $10,624 C. $11,804 D. $118
Solve the equation.5 - 11 + 8 = 7 + x - 2
A. x = 11 B. x = 29 C. x = -7 D. x = -3
Simplify the expression using the order of operations. (7.3)2 + (8.6)2
A. 252.81 B. 127.25 C. 31.8 D. 63.6
Perform the indicated operation. Write the answer in standard form.(-5 + 4i)(2 + i)
A. -6 - 13i B. -14 - 13i C. -6 + 3i D. -14 + 3i