Answer the following question with a starting point of simultaneous long run and short run macroeconomic equilibrium, with the overall production level in the economy at the natural rate level of real GDP (YNR). This equilibrium may be illustrated in a diagram with the average price level (P) measured on the vertical axis, and real GDP (Y) measured on the horizontal axis. The long run equilibrium is represented by the intersection of the vertical long run aggregrate supply function (LRAS), and the downward sloping aggregate demand function (AD). The short run equilibrium is represented by the intersection of the upward sloping short run aggregate supply function (SRAS), and the downward sloping aggregate demand function (AD). (See the diagram on the left panel.)
Question: If a recession were to occur as a result of an inward shift in the AD function (see the diagram on the right panel), the result is:
A) A decrease in the average price level (P), and an increase in real GDP (Y).
B) An increase in the average price level (P), and an increase in real GDP (Y).
C) An increase in the average price level (P), and a decrease in real GDP (Y).
D) A decrease in the average price level (P), and a decrease in real GDP (Y).
E) No change in the average price level (P), and no change in real GDP (Y).
Answer: D) A decrease in the average price level (P), and a decrease in real GDP (Y).
You might also like to view...
Refer to the table above. If the market price of wine is $4/bottle, and the market demand for wine is 65 bottles, Sandra's demand for wine is:
A) 18 bottles. B) 40 bottles. C) 47 bottles. D) 111 bottles.
Refer to the figure above. If the relative price of S were to increase, then the price line would
A) shift out in a parallel fashion. B) shift in in a parallel fashion. C) become steeper. D) become flatter.
In the model of public goods, when the government chooses public goods provision optimally
A) there is no public goods production. B) public goods are provided in an amount equal to private goods. C) the marginal rate of substitution of private goods for public goods equals the marginal rate of transformation. D) GDP is maximized.
The graph shown best represents:
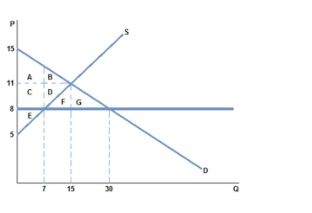
A. a non-binding price ceiling.
B. a non-binding price floor.
C. a missing market.
D. a market for an inferior good.