A subsidy to buyers has been placed in the market in the graph shown. The result is:
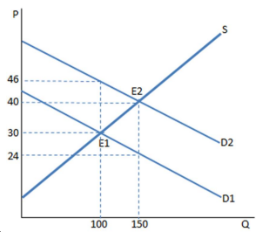
A. a higher quantity bought and sold at a higher price.
B. customers are worse off than before the subsidy.
C. producers are worse off than before the subsidy.
D. None of these is true.
A. a higher quantity bought and sold at a higher price.
You might also like to view...
Refer to Figure 2-4. A movement from Y to Z
A) represents an increase in the demand for plastic products. B) is the result of a decrease in preference for food products. C) is the result of advancements in plastic production technology. D) is the result of advancements in food production technology.
Which of the following is a predictable side effect of increased government activity (for example, taxes and subsidies) designed to redistribute income among citizens?
a. improvement in the operational efficiency of government agencies b. budget surpluses c. reduction in the poverty rate d. an increase in rent-seeking activity
The fiscal policy response to the recession of 2008-2009 was
a. a substantial increase in the budget deficit just as Keynesian analysis would recommend. b. a balanced budget, just as Keynesian analysis would recommend. c. a substantial increase in the budget deficit, which was highly inconsistent with Keynesian analysis. d. a shift of the federal budget toward a large surplus, which reflected the views of the critics of Keynesian economics.
The perfectly competitive firm cannot influence the market price because
A. its production is too small to affect the market. B. its costs are too high. C. it has market power. D. a few buyers have control over the market price.