Refer to the information for this hypothetical economy provided in Table 20.1 below to answer the question(s) that follow.Table 20.1 2014 2015 2016QuarterIIIIIIIVIIIIIIIVIIIIIIIVOutput9094981029691888487949087Refer to Table 20.1. In this economy, a peak existed around the
A. third quarter of the year 2014.
B. fourth quarter of the year 2015.
C. fourth quarter of the year 2014.
D. third quarter of the year 2016.
Answer: C
You might also like to view...
One feature of the gold standard was that
a. countries had almost complete control over their own monetary policies b. surplus could cause the money supply to decrease c. slow gold production could lead to deflation d. exchange rates were unstable e. each currency was worth the same as other currencies
The application of game theory to economics allows us to understand firm behavior in some forms of oligopoly. Game theory suggests that in a two-firm industry, each firm will
a. avoid pricing high when the other prices low b. select high prices and defend that selection because, in the long run, their profits are higher than if they competed by lowering prices c. end up mistaking the other's intentions, which results in low prices and low profit for both in the long run d. end up colluding with the other to form a cartel e. agree with the other not to allow other firms to enter the industry
If the aggregate supply curve is vertical, then the short-run Phillips curve will
A. be horizontal. B. also be vertical. C. slope upward. D. slope downward.
Refer to the information provided in Figure 5.3 below to answer the question(s) that follow.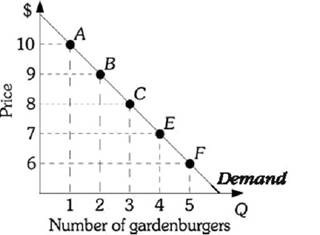 Figure 5.3Refer to Figure 5.3. Use the midpoint formula. If the price of a gardenburger decreases from $9 to $8, the price elasticity of demand equals ________ and demand is ________.
A. -6.33; elastic B. 6.33; elastic C. -19.0; inelastic D. -0.16; inelastic