Figure 10-3
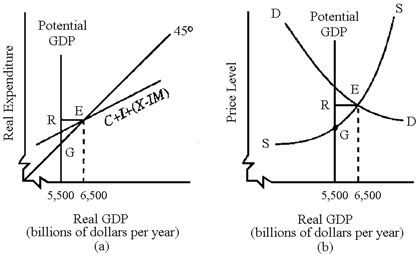
In Figure 10-3, both graphs (a) and (b) indicate that the economy is experiencing a(n)
a.
recessionary gap of RE.
b.
recessionary gap of RG.
c.
inflationary gap of RG.
d.
inflationary gap of RE.
d
You might also like to view...
In an open economy, what is the source of supply of dollars in the foreign-currency exchange market?
A. Net exports B. Exports C. Net capital outflow D. Investment and net capital outflow
The United States does not use subsidies as part of its policies
Indicate whether the statement is true or false
What is the marginal tax rate of a lump-sum tax of $5,000?
The United States SRAS curve may shift to the right if we ____________________ Malaysia and the dollar ________________ against the Malaysian ringgit
A) buy raw materials from; appreciates B) buy raw materials from; depreciates C) sell finished goods to; appreciates D) sell finished goods to; depreciates