This graph demonstrates the domestic demand and supply for a good, as well as the world price for that good.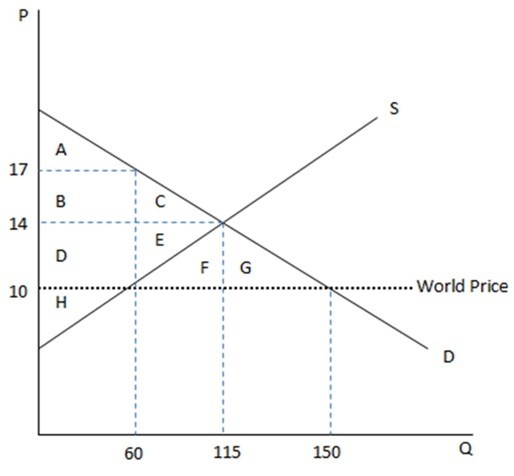 According to the graph shown, if this economy were to open to trade, the amount consumed domestically would:
A. increase by 35.
B. decrease by 90.
C. decrease by 35.
D. increase by 90.
Answer: A
You might also like to view...
To reassure investors who were unwilling to buy mortgages in the secondary market, the U.S. Congress used two government sponsored enterprises, ________, to sell bonds to investors and use the funds to purchase mortgages from banks
A) the Securities and Exchange Commission (SEC) and the Federal Trade Commission (FTC) B) ACORN and the Federal Housing Administration (FHA) C) Fannie Mae and Freddie Mac D) the Fed and the Treasury Department
Many states use container redemption programs to encourage reuse of glass bottles and other recyclable containers
Suppose a state has a current redemption program that imposes a 10-cent per container fee, and then the state increases the fee to 15 cents per container. What is the expected impact of this change on the optimal quantity of unredeemed (scrapped) containers? A) Optimal quantity increases B) Optimal quantity decreases C) Optimal quantity remains unchanged D) We cannot determine the outcome of this policy change without having more information
If the overall balance in the balance of payments account is in ________, there can be an accumulation of official reserve assets by the country or a decrease in foreign official reserve holdings of the country's assets.
A. surplus B. equilibrium C. deficit D. remission
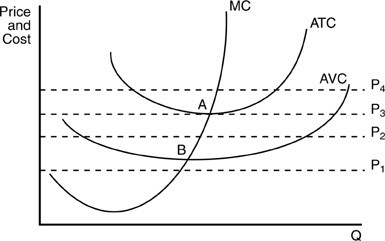 In the above figure, if price is equal to P4, the firm will
A. incur an economic loss. B. earn positive economic profits. C. shut down. D. earn zero economic profits.