Suppose that this graph describes the current labor market for high school teachers: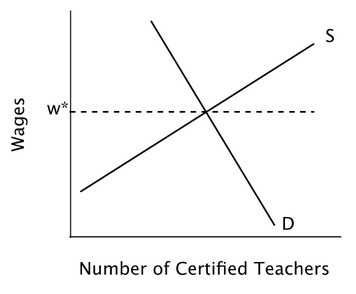 Suppose supply of labor decreases. At the new equilibrium, wages would be ________ and ________ teachers would be hired.
A. lower; fewer
B. higher; fewer
C. higher; more
D. lower; more
Answer: B
You might also like to view...
The period from 1983 to 1990 was characterized by
a. decreasing budget deficits and increasing trade surpluses. b. persistently high inflation. c. below average rates of real GDP growth. d. consistent growth of real GDP and decreasing rates of inflation.
Between 2010 and 2014, the annual rate of output growth in China was approximately equal to
A) 2%. B) 5%. C) 9%. D) 20%.
Using Table 6.1, from the 1982-1984 base to 2010, prices increased 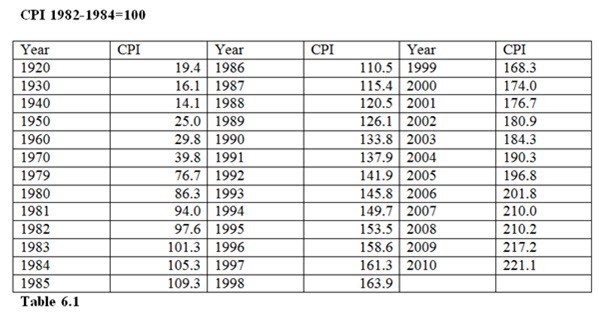
A. 121.1 times. B. by 121.1 dollars per week on monthly bills. C. 121.1%. D. 221.1%.
Each of the following has contributed to the growing number of homeless people except
A. the rising crime rate. B. gentrification of the cities. C. the decline in the number of entry-level factory jobs. D. the deinstitutionalization of the mentally ill.