Following are measurements of soil concentrations (in mg/kg) of chromium (Cr) and nickel (Ni) at 20 sites in the area of Cleveland, Ohio. These data are taken from the article “Variation in North American Regulatory Guidance for Heavy Metal Surface Soil Contamination at Commercial and Industrial Sites”.
Cr: 34 1 511 2 574 496 322 424
269 140 244 252 76 108 24 38
18 34 30 191
Ni: 23 22 55 39 283 34 159 37
61 34 163 140 32 23 54 837
64 354 376 471
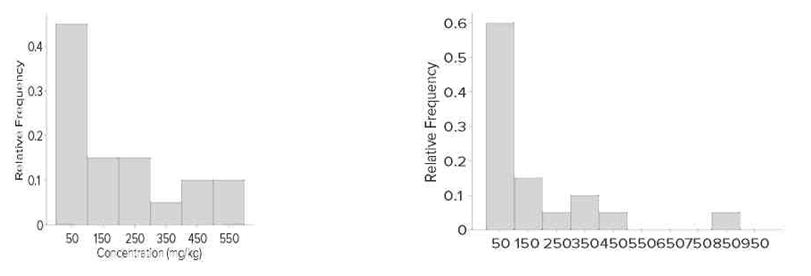
a. Construct a histogram for each set of concentrations.
b. Construct comparative boxplots for the two sets of concentrations.
c. Using the boxplots, what differences can be seen between the two sets of
concentrations?
(a) Here are histograms for each group. Other choices for the endpoints are possible.
(b)
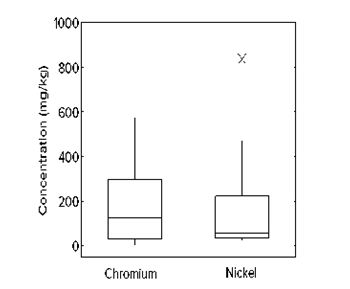
(c) The concentrations of nickel are on the whole lower than the concentrations of
chromium. The nickel concentrations are highly skewed to the right, which can be
seen from the median being much closer to the first quartile than the third. The
chromium concentrations are somewhat less skewed. Finally, the nickel
concentrations include an outlier.
You might also like to view...
Find the h and g parameters of the two-port network in Fig.19.90 as functions of s.
 figure 1.png)
Attenuation in a coaxial cable will increase if ________
A) temperature increases B) cable resistance decreases C) skin effect increases D) cabling length decreases
There are four resistors in a circuit with an applied voltage of 120V. The voltage drops across three resistors is
15V each. What is the voltage drop across the fourth resistor? a. 15V b. 45V c. 75V d. 120V
What is a accumulator?
What will be an ideal response?