Graph the rational function and analyze it in the following way: find the intercepts, asymptotes, use limits to describe the behavior at the vertical asymptotes and the end behavior. Find the domain and range. Determine where the function is continuous and where it is increasing and decreasing. Find any local extrema. f(x) = 

What will be an ideal response?
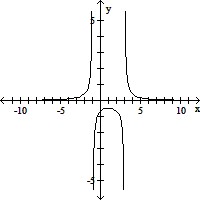
x-intercept: none
y-intercept: 
Vertical asymptotes: x = 3, x = -1
Horizontal asymptote: y = 0 f(x) = ?,
  f(x) = -?,
  f(x) = -?,
  f(x) = ?
 f(x) = 0,
  f(x) = 0
Domain: (-?, -1) ? (-1, 3) ? (3, ?)
Range: (-?, -0.5] ? (0, ?)
Continuity: all x ? -1, 3
Local maximum at (1, -0.5)
Increasing on: (-?, -1), (-1, 1)
Decreasing on: (1, 3), (3, ?)
You might also like to view...
Use the graph to estimate all solutions to the system of equations.y2 - x2 = 16x2 + 5y2 = 80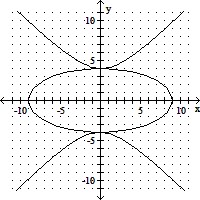
A. (0, -4), (-4, 0) B. (0, 0) C. (0, -4), (0, 4) D. (0, -4), (0, 0), (0, 4)
Solve the problem. =
=
A. 15
B. 1
C. 
D. 15!
E. none of these
The figure below is a regular hexagon ABCDEF with center O. (P, Q, R, S, T, and U are the midpoints of the sides.)
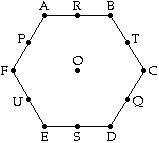 The image of A under a 300° counterclockwise rotation with center O is
A. B. B. F. C. C. D. E. E. none of these
Find all solutions of the equation in the interval [0, 2?).tan  =
= 
A. 
B. 
C. 
D. 