Which of the following physical situations would best be modeled by the graph?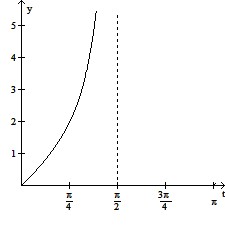
A. The length y of a shadow cast by a horizontal flagpole on a vertical wall between sunrise and noon, where t is the angle shown.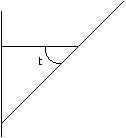
B. The monthly average ocean temperature y in degrees Fahrenheit during month t, where t = 1 corresponds to January.
C. The number of hours y of sunlight during month t, where t = 1 corresponds to January.
D. The length y of a shadow cast by a tree between sunrise and noon, where t is the angle of elevation of the sun.
Answer: A
You might also like to view...
Provide an appropriate response.The domain of the function f(x) =  is
is
A. all real numbers ? 2 B. all real numbers except 4 and -4 C. all real numbers ? -2 except 4 D. all real numbers ? 2 except 4 E. all real numbers ? -2
Find the exact value by using a half-angle identity.sin 
A. - 

B. 

C. - 

D. 

Determine any data values that are missing from the table, assuming that the data represent a linear function.
A. missing x: -3; missing y: -2 B. Missing x: -1; missing y: -1 C. Missing x: -2; missing y: -1 D. Missing x: -3; missing y: 0
If possible, simplify the expression. If any variables exist, assume that they are positive. -
-  +
+ 
A. 
B. 
C. - 
D. 