Answer the question.Graph the parabola  . Now graph
  . What is the effect of multiplying by 5?
What will be an ideal response?
The graph of the parabola is narrower.
You might also like to view...
Solve the equation. =
=  (All numbers are approximate.)
A. M ? 0.60 B. M = 10.6622807 C. M = 0.96929825 D. M ? 2.5
Write an equation of the tangent line to the graph of y = f(x) at the point on the graph where x has the indicated value.f(x) =  , x = 0
A. y = - 8x - 4 B. y = 8x + 4 C. y = - 8x + 4 D. y = 8x - 4
Solve.The function f(x) = 0.68x2 - 0.03x + 7.3 models the average weight in ounces for a mouse who is fed x grams of a special food per day. Find and interpret f(16).
A. 290.4; when a mouse is fed an average of 290.4 ounces of the special food per day, its weight will be at least 16 ounces. B. 180.9; when a mouse is fed 16 grams of the special food per day, its average weight is 180.9 ounces. C. 17.7; the average amount of the special food that 16 mice should be fed is 17.7 ounces. D. 181.35; 16 mice gained an average of 181.35 ounces per day when fed the special food.
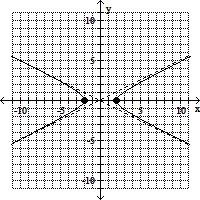
Identify and graph the conic section. Label the center and/or vertex as appropriate. +
+  = 1
= 1
A. ellipse; center (0, 0);
(-2, 0), (2, 0), (0, -1), (0, 1)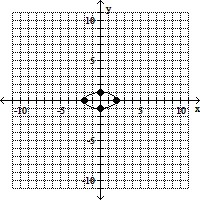
B. ellipse; center (0, 0);
(-1, 0), (1, 0), (0, -2), (0, 2)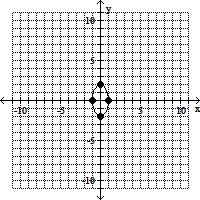
C. hyperbola; center (0, 0);
(-1, 0), (1, 0)
D. hyperbola; center (0, 0);
(-2, 0), (2, 0)