The circle graph shows the results of the student council presidential election. The complete circular area represents 100% of the votes.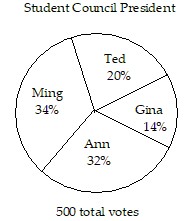 The circle graph shows what percent of the vote each person received.Who got the fewest votes?
A. Ann
B. Ted
C. Ming
D. Gina
Answer: D
Mathematics
You might also like to view...
Graph the function.f(x) = x2 - 4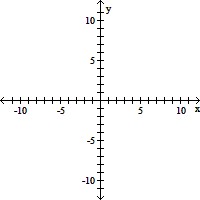
A. 
B. 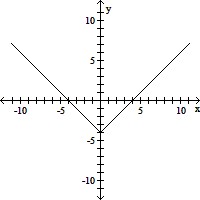
C. 
D. 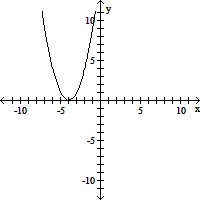
Mathematics
Provide an appropriate response.Solving for which variable in which equation involves the least amount of work? 5x - 7y = -60-9x - 3y = 30
A. x in equation 1 B. y in equation 1 C. x in equation 2 D. y in equation 2
Mathematics
Solve by substitution and check. x + 2y = -4 -2x + 3y = -6
A. (0, -2) B. No solution C. (1, -3) D. (2, 0)
Mathematics
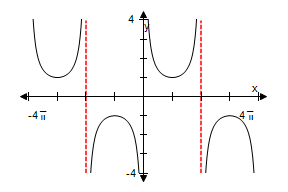
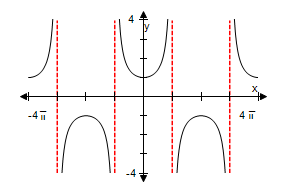
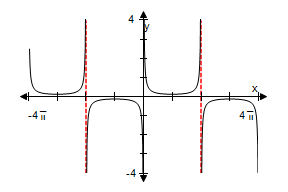
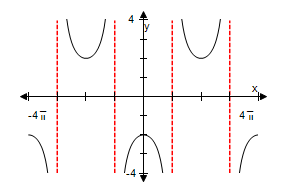
Use a graphing utility to select the graph of the function below, making sure to show at least two periods.
?
 ?
?
?

?
?
?
?
?
?
Xscl = 
?
?
?
?
?
?
?
Xscl =
?
?
?
?
?
?
Xscl =
?
?
?
?
?
Xscl =
A. ?
| ? |
?
B. ?
| ? |

C. ?
? | ? |
?
D. ??
? |

E. ?
? |
Mathematics