Write the best-fit linear model for the data.A study was conducted to compare the average time spent in the lab each week versus course grade for computer students. The results are recorded in the table below. Find a linear function that approximates a student's course grade as a function of the number of hours spent in lab. Number of hours spent in lab Grade (percent) 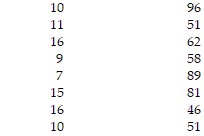
A. y = 88.6 - 1.86x
B. y = 44.3 + 0.930x
C. y = 1.86 + 88.6x
D. y = 0.930 + 44.3x
Answer: A
Mathematics
You might also like to view...
Choose the graph that represents the given function without using a graphing utility.f(x) = 
A. 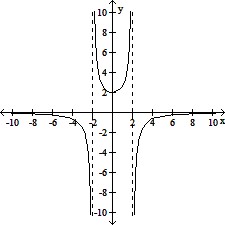
B. 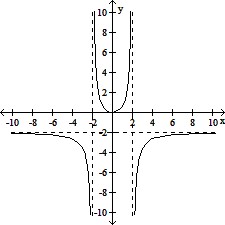
C. 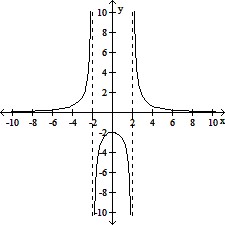
D. 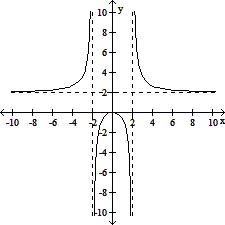
Mathematics
Find  FIGURE 1.png) if
if  Figure 2.png)
What will be an ideal response?
Mathematics
Convert to a mixed numeral.
A. 1
B. 2
C. 3
D. 2
Mathematics
Solve the problem.The value V of a car that is t years old can be modeled by V(t) = 19,558(0.82)t. According to the model, when will the car be worth $6000? Round to the nearest tenth of a year.
A. 51.1 yr B. 6.0 yr C. 0.9 yr D. 1.8 yr
Mathematics