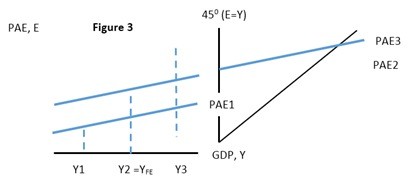
 Using Figure 3 above, suppose that the economy was at Y2. This level of GDP would be considered:
A. inflationary.
B. a long run level of output.
C. recessionary.
D. unsustainable over time.
Answer: B
You might also like to view...
The rightward shift of the RS curve will lead to a ________ in the U.S. exchange rate, ________ in real GDP, and a ________ in the price level
A) rise; a decrease; fall B) rise; an increase; rise C) fall; an increase; rise D) rise; an increase; fall E) fall; an increase; fall The figure above shows the market for loanable funds. The supply of loanable funds curve shifts rightward.
The market supply curve shows how the total quantity supplied of a good varies as input prices vary, holding constant all the other factors that influence producers' decisions about how much to sell
a. True b. False Indicate whether the statement is true or false
An increase in the price level, other things remaining the same, may be expected to result in ____ the consumption function.
A. a downward shift of B. a movement along C. an upward shift in D. no effect on
Who benefits from a subsidy to buyers?
A. Only sellers benefit from any kind of subsidy. B. The benefit is shared depending on the elasticity of the supply and demand curves. C. Only consumers benefit, since it is their subsidy. D. None of these statements is true.