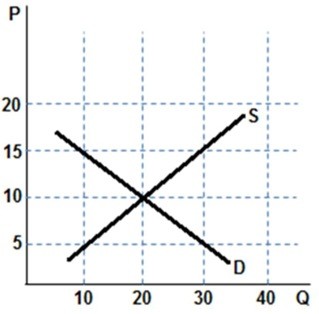
 According to the graph shown, at a price of $15, there is a:
A. shortage of 20.
B. surplus of 20.
C. shortage of 30.
D. shortage of 10.
Answer: B
You might also like to view...
The above figure shows the demand curves in four different markets. If each of the markets has an identical upward sloping supply curve and the same tax is levied on suppliers, which market would produce the smallest amount of deadweight loss?
A) A B) B C) C D) D E) C and D
Which of the following correctly defines the term "equilibrium"?
A) It refers to analysis that uses data to arrive at conclusions. B) It refers to a situation where all agents are simultaneously optimizing. C) It refers to an optimizing decision made by an individual economic agent. D) It refers to government intervention that efficiently allocates scarce resources.
Rational expectations are more accurate than adaptive expectations, ________
A) on average B) always C) because they require less information D) except when policies have changed
Which of the diagrams correctly portrays the demand (D) and marginal revenue (MR) curves of a pure monopolist that is able to price discriminate by charging each customer his or her maximum willingness to pay?
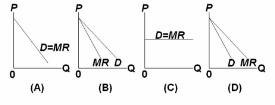
A. A.
B. B.
C. C.
D. D.