The graph below indicates the number of new cases of Chalk Dust Disease (CDD) diagnosed each month in the Mathland. Let T(t) represent the total number of new cases per month, F(t) the number of new cases per year among algebraists, G(t) the number of new cases per year among geometers, and t the number of years since January 1, 1990.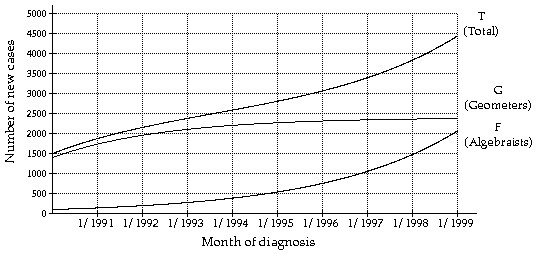 Estimate (G + F)(9) and interpret its meaning.
A. 2100; In January, 1999, there were about 2100 new cases of CDD diagnosed among algebraists.
B. 4400; In January, 1999, there were about 4400 new cases of CDD diagnosed.
C. 4400; In January, 1999, there were about 4400 new cases of CDD diagnosed among geometers.
D. 2400; In January, 1999, there were about 2400 new cases of CDD diagnosed among geometers.
Answer: B
Mathematics
You might also like to view...
Replace the polar equation with an equivalent Cartesian equation. r = 24 sin ?
A. x2 + (y - 24)2 = 144 B. x2 + (y - 12)2 = 144 C. y = 24 D. (x - 12)2 + y2 = 144
Mathematics
Write a fraction to represent the shaded area of the figure.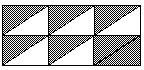
A. 
B. 
C. 
D. 
Mathematics
Divide.-  ÷
÷ 
A. - 
B. - 
C. 
D. - 
Mathematics
Find fraction notation and simplify. 87.5%
A. 
B. 
C. 
D. 
Mathematics