Between the pair of numbers, insert the appropriate sign: <, =, or >.

A. =
B. <
C. >
Answer: B
You might also like to view...
Let B denote the price of a bag of groceries at time t. It is found that  changes sign from negative to positive at
  . What can be concluded about the graph of B at the point
src="https://sciemce.com/media/3/ppg__cognero__Section_6.2_Rates_of_Change_for_Other_Functions__media__798741ee-4865-4da6-8425-4db958d6e218.PNG" style="font-size:14.6667px;vertical-align:middle;" />?
??
A. The graph of B reaches a maximum at .
B. The graph of B reaches a minimum at .
C. The graph of B is increasing at .
D. The graph of B is decreasing at .
Find the equation of the line described, and express your answer in the specified form.Parallel to the line x + 4y = 5; passes through the point (0, 0); slope-intercept form
A. y =  x
x
B. y = -  x + 5
x + 5
C. y = 1
D. y = -  x
x
Solve the problem.The table lists the number of persons voting in an election by election year and sex, for a small community. 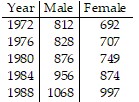 Let this table be a partial numerical representation of a function f, where
  computes the number of persons who voted in the year x whose sex is y. Evaluate
  Interpret the result.
A. f(1984, Male) = 956 The number of males who voted in 1984 was 956. B. f(1984, Male) = 963 The number of people who voted in 1984 was 963, all male. C. f(1984, Male) = 963 The number of males who voted in 1984 was 963. D. f(1984, Male) = 828 The number of males who voted in 1984 was 929.
Perform the indicated operation and write the answer in lowest terms. +
+  -
- 
A. 
B. 
C. 
D. 