Refer to the below graphs. Which graph shows the immediate market period for supply?
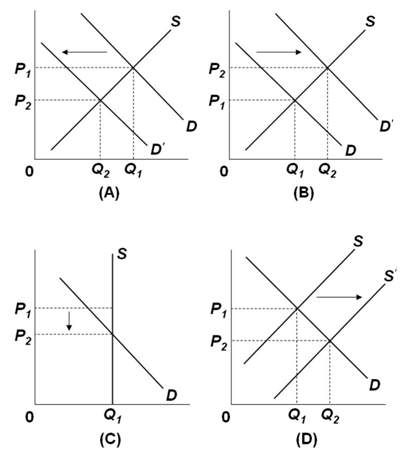
A. Graph A
B. Graph B
C. Graph C
D. Graph D
C. Graph C
You might also like to view...
Refer to Table 9-12. If the actual terms of trade are 1 belt for 1.5 swords and 50 belts are traded, how many belts will Estonia gain compared to the "without trade" numbers?
A) 0 B) 10 C) 40 D) 50
Everything else held constant, if aggregate output is to the ________ of the LM curve, then there is an excess ________ of money which will cause the interest rate to rise
A) right; supply B) right; demand C) left; supply D) left; demand
Although all points on the PPF are efficient, that alone does not tell us which point is "best" for the society
a. True b. False Indicate whether the statement is true or false
Market equilibrium is the intersection of the demand curve and the social cost curve
a. True b. False Indicate whether the statement is true or false