Using Figure 1 below, if the aggregate demand curve shifts from AD3 to AD2 the result in the long run would be:
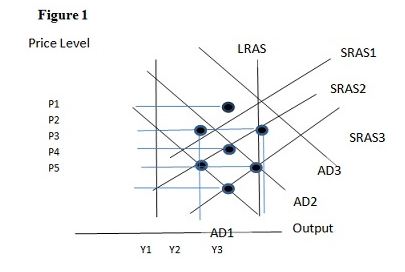
A. P1 and Y2.
B. P3 and Y2.
C. P2 and Y1.
D. P3 and Y1.
B. P3 and Y2.
You might also like to view...
In the long run, in a perfectly competitive industry:
A. economic loss tends to persist. B. the number of firms in the industry will increase. C. economic profit tends to persist. D. economic profit and loss are driven to zero by entry and exit.
Answer the next question using the following budget information for a hypothetical economy. All data are in billions of dollars. Also assume that all budget surpluses are used to pay down the public debt. Government SpendingTax RevenuesGDPYear 1$800$825$4,000Year 28508504,200Year 39008754,350Year 49509004,500Year 51,0009254,600Assume that year 1 is the first year for this economy and year 3 is the current year. What is the public debt in this economy at year 3?
A. $75 billion B. $50 billion C. $25 billion D. $0 billion
According to the above table, if the minimum wage is set at $20 per hour, then
A) the quantity of labor demanded will increase until it is equal to the quantity of labor supplied. B) there is an excess demand for labor. C) the labor demand curve will shift until $20 is the new equilibrium real wage rate. D) the quantity of labor supplied exceeds the quantity of labor demanded by 50 million hours per month. E) the labor supply curve will shift until $20 is the new equilibrium real wage rate.
The unregulated profit maximizing monopolist prefers to operate where demand is inelastic
Indicate whether the statement is true or false