Solve the problem using your calculator.A study was conducted to compare the average time spent in the lab each week versus course grade for computer students. The results are recorded in the table below. Use a graphing calculator to model the data with a linear function that predicts a student's course grade as a function of the number of hours spent in lab. Number of hours spent in lab Grade (percent) 10 96 11 51 16 62 9 58 7 89 15 81 16 46 10 51
A. y = 0.930 + 44.3x
B. y = 1.86 + 88.6x
C. y = 44.3 + 0.930x
D. y = 88.6 - 1.86x
Answer: D
Mathematics
You might also like to view...
Identify the type of surface represented by the given equation. y2 + z2 = 7
A.
| Ellipsoid |
B.
| Cylinder |
C.
| Paraboloid |
D.
| Parabolic cylinder |
Mathematics
Name the decimal by writing it in word form.0.3
A. three-thousandths B. three-hundredths C. three-tenths D. three-ten-thousandths
Mathematics
Using the horizontal-line test, determine whether the function is one-to-one.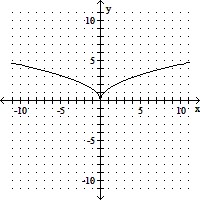
A. one-to-one B. not one-to-one
Mathematics
Divide. Express the quotient in lowest terms. ÷
÷ 
A. 
B. 
C. 
D. 
Mathematics