Find the volume generated by revolving about the x-axis the region bounded by the following graph.y = x,x = 2,x = 6
A. 16?
B.  ?
?
C.  ?
?
D. 20?
Answer: B
You might also like to view...
A hypothesis test is to be performed. State the null and alternative hypotheses.During one flu epidemic the proportion of adults nationwide who have come down with the flu is 8%. The manufacturer of a flu vaccine claims that those who have been vaccinated are less likely to catch the flu.
A. Null hypothesis: proportion of those vaccinated catching the flu = 8% Alternative hypothesis: proportion of those vaccinated catching the flu < 8% B. Null hypothesis: proportion of those vaccinated catching the flu = 8% Alternative hypothesis: proportion of those vaccinated catching the flu ? 8% C. Null hypothesis: proportion of those vaccinated catching the flu < 8% Alternative hypothesis: proportion of those vaccinated catching the flu = 8% D. Null hypothesis: proportion of those vaccinated catching the flu > 8% Alternative hypothesis: proportion of those vaccinated catching the flu < 8%
Provide an appropriate response.Determine the slope of the equation: y = 2
A. no slope B. 2 C. 0 D. 1
Find the missing numbers.
A. (a) = 8, (b) = 3, (c) = 6 B. (a) = 8, (b) = 3, (c) = 5 C. (a) = 9, (b) = 4, (c) = 7 D. (a) = 7, (b) = 2, (c) = 5
Use the table of record trout lengths at Yosemite Lake to answer the question. To find the average, add up the values you are interested in and then divide the sum by the number of values. Round your answer to the nearest tenth. 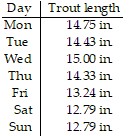 Find the average length of record trout caught during the entire week.
A. 97.3 in. B. 14.3 in. C. 13.9 in. D. 9.7 in.