This graph demonstrates the domestic demand and supply for a good, as well as a quota and the world price for that good.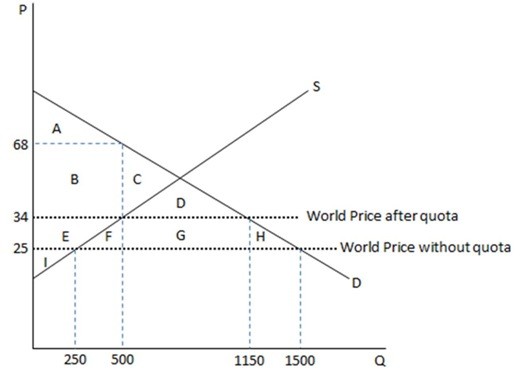 According to the graph shown, the government can restrict trade by imposing a quota of:
A. 1500.
B. 350.
C. 900.
D. 1150.
Answer: B
You might also like to view...
Which of the following statements is NOT true about using per capita real GDP to measure a nation's economic growth?
A) The definition does not indicate how the increase in growth is being disturbed among the nation's population. B) The definition assumes that some of the increase in productivity goes to the poor. C) The definition is not perfect for measuring increases in a nation's productive capacity. D) The definition has understated actual economic growth because it does not take into consideration changes in leisure.
Based on Table 3.1, the pre-trade relative price of a computer in Mexico is
A) three pairs of shoes. B) one pair of shoes. C) one-half pair of shoes. D) one-third pair of shoes. E) None of the above.
The major objective of the Federal Reserve System is to: a. make substantial profits for its member banks
b. help in generating stabilization policies for the economy. c. distribute paper money and coins to banks and retail stores. d. prevent closure (failure) of individual member banks.
Real GDP per person in Westland is $30,000, while real GDP in Eastland is $10,000, Westland's real GDP per person is growing at 3 percent per year and Eastland's real GDP per person is growing at 3 percent per year. If these growth rates persist indefinitely, then:
A. Eastland's real GDP per person will always be exactly $20,000 less than Westland's. B. Eastland's real GDP per person will eventually be greater than Westland's. C. Westland's real GDP per person will always be at least $20,000 greater than Eastland's. D. Eastland's real GDP per person will rise until it equals Westland's real GDP per person.