Use the data in the table to construct a line graph.The following table gives the bushels of cotton shipped (in millions) from 1970 through 1976. Label the x-axis and y-axis for the time and the numerical value variables. 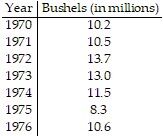
What will be an ideal response?
Answers may vary. One possible answer: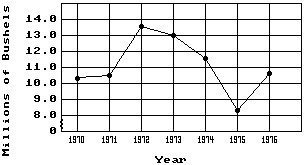
Mathematics
You might also like to view...
Determine convergence or divergence of the alternating series.
A. Converges B. Diverges
Mathematics
Solve the problem.A retailer knows that n games can be sold in a month at a price of  dollars per game. Assume that he buys each game for
  and sells every one that he buys. If he wishes to make a profit of at least
  per month on sales of this game, how many games must he sell each month?
A. 25 ? n ? 35 B. 20 ? n ? 50 C. 20 ? n ? 70 D. 0 ? n ? 20
Mathematics
Use order of operations to simplify the expression.8 - (17 - 12)
A. 3 B. -21 C. 37 D. 13
Mathematics
Convert the rectangular equation to polar form.
x2 + y2 = 25
Mathematics