In the four-part diagram used to construct the IS curve, the upper right-hand graph depicts
A) the IS curve.
B) the relationship between the interest rate and autonomous planned spending.
C) determination of real income by the saving function and the demand for autonomous planned spending function.
D) none of the above.
C
You might also like to view...
In the long run, an increase in the growth rate of the quantity of money ________ the inflation rate and ________ the nominal interest rate
A) raises; does not change B) lowers; raises C) raises; raises D) raises; lowers E) lowers; lowers
Which of the following would cause an increase in quantity of wheat supplied?
A. New, better technology for farming is introduced B. The price of fertilizer farmers use in their fields falls C. The price firms pay for liability insurance falls D. The price farmers receive for their wheat rises
If the slope of a demand curve is constant, then we know that
A) elasticity of demand is also elastic everywhere. B) elasticity of demand is constant and elastic. C) elasticity of demand is inelastic everywhere. D) elasticity of demand varies along the demand curve.
Refer to the information provided in Figure 6.2 below to answer the question(s) that follow.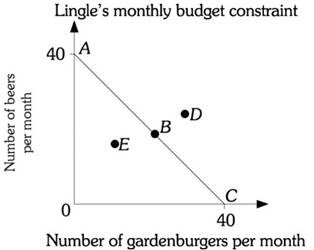 Figure 6.2Refer to Figure 6.2. Assume Mr. Lingle's budget constraint is AC. If the price of a gardenburger is $7.50, the price of a beer is
A. $3.75. B. $4.00. C. $7.50. D. $15.00.