The table shows, for some particular year, a listing of several income levels and, for each level, the proportion of the population in the level and the probability that a person in that level bought a new car during the year. Given that one of the people who bought a new car during that year is randomly selected, find the probability that that person was in the indicated income category. Round your answer to the nearest hundredth. 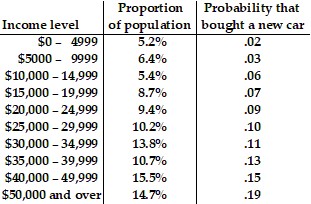 $50,000 and over
A. .24
B. .28
C. .22
D. .25
Answer: D
Mathematics
You might also like to view...
Find the probability.A couple has four children. Assuming that each child is equally likely to be a boy or a girl, find the probability that they have exactly three boys.
A. 
B. 
C. 
D. 
Mathematics
Find the function with the given derivative whose graph passes through the point P.r'(?) = 4 + sec2 ?, P(?, 0)
A. r(?) = 4? +  sec3 ?
B. r(?) = 4? + tan ? - 4?
C. r'(?) = 2?2 + tan ? + 4?
D. r(?) = 2?2 + tan ? - 4?
Mathematics
Perform the indicated operations. +
+ 
A. 
B. 
C. 
D. 
Mathematics
Write the binary representation for the letter or word.Q
A. 1010001 B. 1010100 C. 1010010 D. 100100
Mathematics